Slot data: the RTP and volatility charts behind our catalogue
Two charts built from the same sourced catalogue as every review on this site: the RTP each game actually carries, and what happens when you plot RTP against volatility instead of assuming one predicts the other.
Reviewed
- Games charted
- 5 of 6
- RTP range
- 91.46–96.98%
- Volatility bands
- 3
- Excluded, unsourced
- 1
Every review on this site draws from one sourced catalogue, cross-checked across independent slot databases rather than copied from a provider sheet. This page turns that same catalogue into two charts instead of a table, and adds nothing to it — a figure that could not be established stays out of both, named rather than guessed.
RTP across our licensed slot catalogue
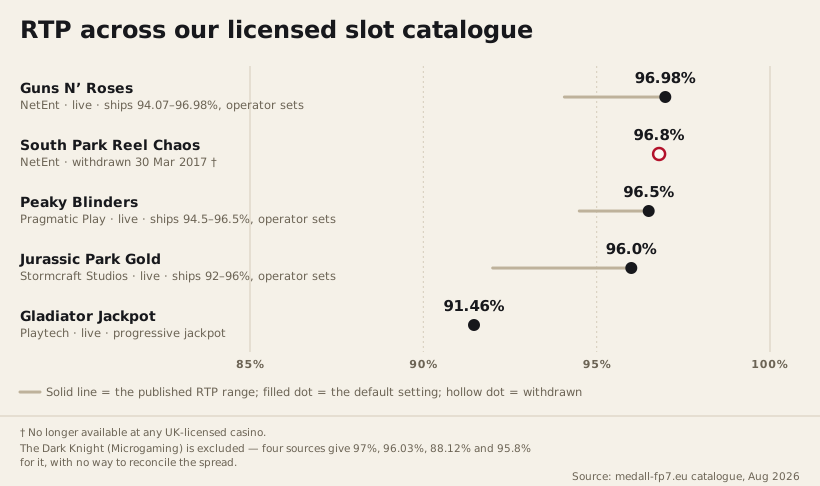
Five of our six catalogued games have a reconcilable RTP. The sixth, The Dark Knight, does not: four separate sources give four different figures for it, so it is recorded as unestablished rather than averaged into something that looks precise but is not.
Embed this chart
Why a range, not one number
Three of these five games are configurable at the operator level: Guns N’ Roses ships at 96.98% or 94.07%, Peaky Blinders at 96.5%, 95.5% or 94.5%, and Jurassic Park Gold at 96.0%, 94.0% or 92.0%. The studio builds one engine and licenses several RTP settings from it, and the casino running the game chooses which setting goes live. A player has no practical way to tell which setting a given site is running without asking directly, because the in-game help file rarely states it in plain terms.
Publishing only the headline figure — the highest setting a game can ship at — would flatter every one of these three games and understate what a player might actually receive. The chart shows the full published range instead, with the default we record marked as the dot, so a reader comparing games sees the honest spread rather than a cherry-picked ceiling.
RTP tells you nothing about volatility
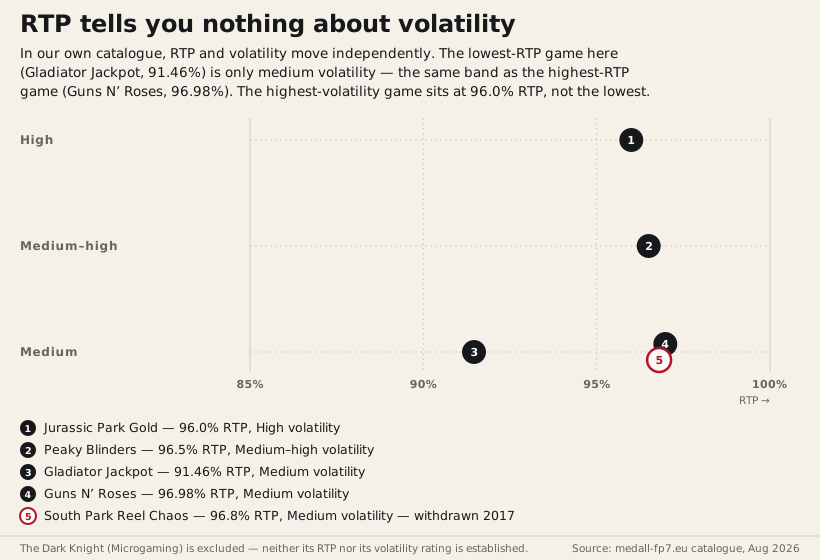
Plotting the same five games against their volatility band gives a plainer result than the first chart. Our lowest-RTP game and our highest-RTP game sit in the same volatility band. Our highest-volatility game is not the lowest on RTP, or even close to it. Across this catalogue, at least, RTP and volatility are two separate dials, not two readings of the same thing.
Embed this chart
How a figure earns its place on this page
Nothing here is generated. Every RTP figure and volatility rating in our catalogue is cross-checked against at least two independent slot databases — SlotCatalog, Bigwinboard, AskGamblers and GMBLRS between them — because no major provider publishes a return figure on a public page of its own. Where two or more sources agree, the entry is marked verified and the figure is eligible to go on a chart. Where they do not agree, the field stays blank rather than being averaged, rounded, or quietly picked from whichever source sounded most confident.
The Dark Knight (Microgaming, 2012) is the clearest case this catalogue holds, and the reason it appears in our full slot index and in the withdrawn-slots archive but not on either chart above. Four independent sources give it four different RTP figures — 97%, 96.03%, 88.12% and 95.8% — and none of them can be reconciled against the others. Its volatility rating was never independently confirmed either, which is a second, separate gap rather than a symptom of the first. A chart is only as trustworthy as the weakest point plotted on it, so a disputed figure stays out of both entirely, named in the text instead of smoothed into something that looks precise but is not.
This is also why the catalogue behind this page changes slowly rather than growing on a schedule. An earlier working draft of this data carried several figures that did not survive a proper sourcing pass — a maximum-win value with no source anywhere, a release year a year out, a multiplier taken from the wrong source — and every one of them was caught by cross-checking rather than by anything visible in how a page rendered. A chart makes a wrong figure more conspicuous than a table does, which is the case for building one at all, and also the reason a second full sourcing pass came before either chart was safe to publish.
Questions about this data
Where does the data behind these charts come from?
Our own catalogue, cross-checked across independent slot databases — SlotCatalog, Bigwinboard, AskGamblers and GMBLRS — rather than a provider specification, because no major provider publishes RTP on a public page. Each individual game entry on this site carries its own dated source note, and this page draws only from figures already verified there.
Why do some RTP figures show a range instead of one number?
Three of these five games ship at several RTP settings, and the operator running the game picks which one to use. Publishing only the top figure would overstate what a player actually gets, so the range travels with the default rather than being dropped.
Can I use these charts on my own site?
Yes — both charts ship with a ready copy-paste embed snippet in the drop-down under the image, crediting this page as the source. They render as plain SVG rather than a raster image, so they scale cleanly at any size, on any screen, without ever losing legibility or turning blurry.
Why is The Dark Knight missing from both charts?
Because we could not establish a real figure. Four sources give four different RTP numbers for it, and its volatility was never independently confirmed either. Charting a disputed figure as fact would be worse than leaving the game out, so it is named and excluded instead.
Does a higher RTP mean a safer or steadier game?
Not on this evidence. Our lowest-RTP game, Gladiator Jackpot at 91.46%, carries only medium volatility — the same band as our highest-RTP game. The single highest-volatility game in the whole catalogue sits mid-table on RTP, not at either extreme. The two figures answer genuinely different questions about a game.
Also in the catalogue